Hadoop is a big data computing framework that generally refers to the main
components: the core,
HDFS,
and
MapReduce. There
are several other projects under the umbrella as well. For more information,
see
this interview
with
Cloudera
CSO Mike Olson.
The Pi is a small, inexpensive ($39)
ARM
based computer. It is meant primarily as an educational tool.
Is Hadoop on the Pi practical?
Nope! Compute performance is horrendous.
Then why?
It's a great learning opportunity to work with Hadoop and multiple nodes.
It's also cool to be able to put your "compute cluster" in a lunch box.
In reality though, this article is much more about setting up your first
Hadoop compute cluster than it is about the Pi.
Could I use this guide to setup a non-Raspberry Pi based (Real) Hadoop
Cluster?
Absolutely, please do. I'll make notes to that effect throughout.
I've been wanting to do this anyhow, let's get started!
Yeah, that's what I said.
Hardware Used
- 3x Raspberry Pis
- 1x 110v Power Splitter
- 1x 4 port 10/100 Switch
- 1x Powered 7 port USB hub
- 3x 2' Cat 5 cables
- 3x 2' USB "power" cables
- 3x Class 10 16GB SDHC Cards
Total cost: about $170 bucks. I picked it all up at my local Microcenter,
including the Pis!
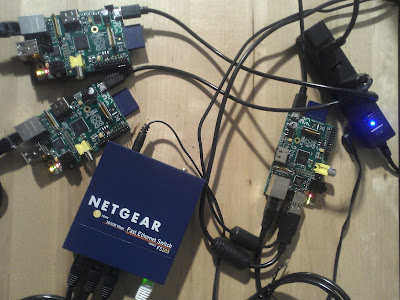 |
| Pi Hadoop Cluster;
caution: may be slow. |
If you would like a a high performance Hadoop cluster just pick one of these
up on the way home:
 |
| This will cost at
least $59.95. Maybe more. Probably more. |
Raspberry Pi Preparation
We'll do the master node by itself first so that this guide can be used
for a single or multi-node setup.
Note: On a non-Pi
installation skip to Networking Preparation (though you may want to update
your OS manually).
Initial Config
- Download the "Raspbian wheezy" image from here
and follow these
directions to set up your first SD card. Soft-float isn't necessary.
- Hook up a monitor and keyboard and start up the device by connecting
up the USB power.
- When the Raspberry Pi config tool launches, change the keyboard layout
first. If you set passwords, etc. with the wrong KB layout you may have
a hard time with that later.
- Change the timezone, then the locale. (Language, etc.)
- Change the default user password
- Configure the Pi to disable the X environment on boot.
(boot_behavior->straight to desktop->no)
- Enable the SSH Daemon (Advanced-> A4 SSH) then exit the
raspi-config tool
- Reboot the Pi. (sudo reboot)
Update The OS
Note: It is assumed from henceforth you are connecting
to the Pi or your OS via
SSH.
You can continue on the direct terminal if you like until we get to
multiple nodes.
- Log on to your Pi using the Raspberry user with the password you set
earlier.
- To pull the newest sources, execute sudo apt-get update
- To pull upgrades for the OS and packages, execute sudo apt-get upgrade
- Reboot the pi. (sudo reboot)
Split the Memory/Overclock
- After logging back into the Pi, execute sudo raspi-config to bring up
the Rasperry Pi config tool.
- Select Option 8, "Advanced Options"
- Select Option A3, "Memory Split"
- When prompted for how much memory the GPU should have, enter the
minimum, "16" and hit enter.
- (If you would like to overclock) Select Option 7, "Overclock", hit
"OK" to the warning, and select what speed you would like.
- On the main menu, select "finish" and hit "Yes" to reboot.
Networking Preparation
Each Hadoop node must have a unique name and static IP. I'll be
following the Debian instructions since the Rasbian build is based on
Debian.
If you're running another distro follow the instructions for that. (
Redhat,
CentOS,
Ubuntu)
First we need to change the machine hostname by editing /etc/hostname
sudo nano /etc/hostname
Note: I'll be using nano throughout the article; I'm sure
some of you will be substituting vi instead. :)
Change the hostname to what you would like and save the file; I used "
Node
1" throughout this document. If you're setting up the second node
make sure to use a different hostname.
Now to change to a static IP by editing /etc/network/interfaces
sudo nano /etc/network/interfaces
Change the iface eth0 to a static IP by replacing "auto eth0" and/or "iface
eth0 inet dhcp" with:
iface eth0 inet static
        address 192.168.1.40
        netmask 255.255.255.0
        gateway 192.168.1.1
Note: Substitute the correct address (IP), netmask, and
gateway for your environment.
Make sure you can resolve DNS queries correctly by editing your
/etc/resolv.conf:
sudo nano /etc/resolv.conf
Change the content to match below, substituting the correct information for
your environment:
domain company.com
search company.com
nameserver 192.168.1.20
nameserver 192.168.1.30
domain=domain suffix for this machine
search=appends when FQDN not specified
nameserver=list DNS servers in order of precedence
We could restart networking etc, but for the sake of simplicity we'll bounce
the box:
sudo reboot
Install Java
If you're going for performance you can install the SunJDK, but getting
that to work requires a bit of extra effort. Since we're on the Pi and
performance isn't our goal, I'll be using OpenJDK which installs easily.
If you're installing on a "real" machine/VM, you may want to diverge a bit
here and go for the real deal (Probably Java ver 6).
After connecting to the new IP via SSH again, execute:
sudo apt-get install openjdk-7-jdk
Ensure that 7 is the version you want. If not substitute the package
accordingly.
Create and Config Hadoop User and Groups
Create the hadoop group:
sudo addgroup hadoop
Create hadoop user "hduser" and place it in the hadoop group; make sure you
remember the password!
sudo adduser --ingroup hadoop hduser
Give hduser the ability to sudo:
sudo adduser hduser sudo
Now logout:
logout
Log back in as the newly created hduser.
From hence forth
everything will be executed as that user.
Setup SSH Certs
SSH is used between Hadoop nodes and services (even on the same node) to
coordinate work. These SSH sessions will be run as the Hadoop user, "hduser"
that we created earlier. We need to generate a keypair to use for EACH node.
Let's do this one first:
Create the certs for use with ssh:
ssh-keygen -t rsa -P ""
When prompted, save the key to the default directory (will be
/home/USERNAME/.ssh/id_rsa).
If done correctly you will be shown the fingerprint and randomart image.
Copy the public key into the user's authorized keys store (~ represents the
home directory of the current user, >> appends to that file to
preserve any keys already there)
cat ~/.ssh/id_rsa.pub >> ~/.ssh/authorized_keys
SSH to localhost and add to the list of known hosts.
ssh localhost
When prompted, type "yes" to add to the list of known hosts.
Download/Install Hadoop!
Note: As of this writing, the newest version of the 1.x
branch (which we're covering) is 1.2. (Ahem, 1.2.1, they're quick) You should check to see what the
newest stable release is and change the download link below accordingly.
Versions and mirrors can be found
here.
Download to home dir:
cd ~
wget http://mirror.catn.com/pub/apache/hadoop/core/hadoop-1.2.0/hadoop-1.2.0.tar.gz
Unzip to the /usr/local dir:
sudo tar vxzf hadoop-1.2.0.tar.gz -C /usr/local
Change the dir name of the unzipped hadoop dir. Note that if your version #
is different you'll need to adjust the command
cd /usr/local
sudo mv hadoop-1.2.0/ hadoop
Set the hadoop dir owner to be the
hadoop user (hduser):
sudo chown -R hduser:hadoop hadoop
Configure the User Environment
Now we'll config the environment for the user (hduser) to run Hadoop. This
assumes you're logged on as that user.
Change to the home dir and open the .bashrc file for editing:
cd ~
nano .bashrc
Add the following to the .bashrc file. It doesn't matter where: (note if
you're using Sun Java on a real box you need to put in the right dir for
JAVA_HOME)
export JAVA_HOME=/usr/lib/jvm/java-7-openjdk-armhf
export HADOOP_INSTALL=/usr/local/hadoop
export PATH=$PATH:$HADOOP_INSTALL/bin
Bounce the box (you could actually just log off/on, but what the hell eh?):
sudo reboot
Configure Hadoop!
(Finally!) It's time to setup Hadoop on the machine. With these steps we'll
set up a single node and we'll discuss multiple node configuration
afterward.
First let's ensure your Hadoop install is in place correctly. After logging
in as hduser, execute:
hadoop version
you should see something like: (differs depending on version)
Hadoop 1.2.0
Subversion https://svn.apache.org/repos/asf/hadoop/common/branches/branch-1.2 -r 1479473
Compiled by hortonfo on Mon May  6 06:59:37 UTC 2013
From source with checksum 2e0dac51ede113c1f2ca8e7d82fb3405
This command was run using /usr/local/hadoop/hadoop-core-1.2.0.jar
Good. Now let's configure. First up we'll set up the environment file
that defines some overall runtime parameters:
nano /usr/local/hadoop/conf/hadoop-env.sh
Add the following lines to set the Java Home parameter (specifies where Java
is) and how much memory the Hadoop processes are allowed to use. There
should be sample lines in your existing hadoop-env.sh that you can just
un-comment and modify.
Note: If you're using a "real" machine rather than a Pi,
change the heapsize to a number appropriate to your machine (physical mem -
(OS + caching overhead)) and ensure you have the right directory for
JAVA_HOME because it will likely be different. If you have a Raspberry Pi version "A" rather than "B", you'll heapsize will need to be much lower since the RAM is halved.
export JAVA_HOME=/usr/lib/jvm/java-7-openjdk-armhf
export HADOOP_HEAPSIZE=272
Now let's configure core-site.xml. This file defines critical operational
parameters for a Hadoop site.
Note: You'll notice we're using "localhost" in the
configuration. That will change when we go to multi-node, but we'll leave it
as localhost for a demonstration of an exportable local only configuration.
nano /usr/local/hadoop/conf/core-site.xml
Add the following lines. If there is already information in the file make
sure you respect
XML
format rules. The "description" field is not required, but I've
included it to help this tutorial make sense.
<configuration>
<property>
<name>hadoop.tmp.dir</name>
<value>/fs/hadoop/tmp</value> <description>Sets the operating directory for Hadoop data.
</description>
<description>The name of the default file system. A URI whose
scheme and authority determine the FileSystem implementation.
The URI's scheme determines the config property (fs.SCHEME.impl) naming
the FileSystem implementation class. The URI's authority is used to
determine the host, port, etc. for a filesystem.
</description>
</property>
</configuration>
It's time to configure the mapred-site.xml. This file
determines where the mapreduce job tracker(s) run. Again, we're using
localhost for now and we'll change it when we go to multi-node in a bit.
nano /usr/local/hadoop/conf/mapred-site.xml
Add the following lines:
<configuration>
  <property>
    <name>mapred.job.tracker</name>
    <value>localhost:54311</value>
    <description>The host and port that the MapReduce job tracker runs
    at.  If "local", then jobs are run in-process as a single map
    and reduce task.
    </description>
  </property>
</configuration>
Now on to hdfs-site.xml. This file configures the HDFS parameters.
nano /usr/local/hadoop/conf/hdfs-site.xml
Add the following lines:
Note: The dfs.replication value sets how many copies of any given file
should exist in the configured HDFS site. We'll do 1 for now since there is
only one node, but again when we configure multiple nodes we'll change this.
<configuration>
  <property>
    <name>dfs.replication</name>
    <value>1</value>
    <description>Default block replication.
    The actual number of replications can be specified when the file is created.
    The default is used if replication is not specified in create time.
    </description>
  </property>
</configuration>
Create the working directory and set permissions
sudo mkdir -p /fs/hadoop/tmp
sudo chown hduser:hadoop /fs/hadoop/tmp
sudo chmod 750 /fs/hadoop/tmp/
Format the working directory
/usr/local/hadoop/bin/hadoop namenode -format
Start Hadoop and Run Your First Job
Let's roll, this will be fun.
Start it up:
cd /usr/local/hadoop
bin/start-all.sh
Now let's make sure it's running successfully. First we'll use the
jps
command (Java PS) to determine what Java processes are running:
jps
You should see the following processes: (ignore the number in front, that's
a process ID)
4863 Jps
4003 SecondaryNameNode
4192 TaskTracker
3893 DataNode
3787 NameNode
4079 JobTracker
If there are any missing processes, you'll need to review logs. By default,
logs are located in:
/usr/local/hadoop/logs
There are two types of log files: .out and .log. .out files detail process
information while .log files are the logging output from the process.
Generally .log files are used for troubleshooting. The logfile name standard
is:
hadoop-(username)-(processtype)-(machinename).log
i.e.
hadoop-hduser-jobtracker-node1.log
In this, like many other articles, we'll use the included wordcount example.
For the wordcount example you will need plain text large enough to be
interesting. For this purpose, you can download plain text books from
Project
Gutenberg.
After downloading 1 or more books (make sure you selected "Plain Text UTF-8"
format) copy them to the local filesystem on your Hadoop node using SSH (via
SCP or similar). In
my example I've copied the books to
/tmp/books.
Now let's copy the books onto the HDFS filesystem by using the Hadoop
dfs
command.
cd /usr/local/hadoop
bin/hadoop dfs -copyFromLocal /tmp/books /fs/hduser/books
After copying in the book(s), execute the wordcount example:
bin/hadoop jar hadoop*examples*.jar wordcount /fs/hduser/books /fs/hduser/books-output
You'll see the job run; it may take awhile... remember these Pis don't
perform all that well. Upon completion you should see something like this:
13/06/17 15:46:54 INFO mapred.JobClient: Job complete: job_201306170244_0001
13/06/17 15:46:55 INFO mapred.JobClient: Counters: 29
13/06/17 15:46:55 INFO mapred.JobClient:   Job Counters
13/06/17 15:46:55 INFO mapred.JobClient:     Launched reduce tasks=1
13/06/17 15:46:55 INFO mapred.JobClient:     SLOTS_MILLIS_MAPS=566320
13/06/17 15:46:55 INFO mapred.JobClient:     Total time spent by all reduces waiting after reserving slots (ms)=0
13/06/17 15:46:55 INFO mapred.JobClient:     Total time spent by all maps waiting after reserving slots (ms)=0
13/06/17 15:46:55 INFO mapred.JobClient:     Launched map tasks=1
13/06/17 15:46:55 INFO mapred.JobClient:     Data-local map tasks=1
13/06/17 15:46:55 INFO mapred.JobClient:     SLOTS_MILLIS_REDUCES=112626
13/06/17 15:46:55 INFO mapred.JobClient:   File Output Format Counters
13/06/17 15:46:55 INFO mapred.JobClient:     Bytes Written=229278
...
The results from the run, if you're curious, should be in the last part of
the command you executed earlier. (/fs/hduser/books-output in our case) Update: to check the output use the hadoop dfs command a la:
hduser@rasdoop1 /usr/local/hadoop $ bin/hadoop dfs -ls /fs/hduser/books-output
Found 3 items
-rw-r--r--   3 hduser supergroup          0 2015-05-05 05:00 /fs/hduser/books-output/_SUCCESS
drwxr-xr-x   - hduser supergroup          0 2015-05-05 04:35 /fs/hduser/books-output/_logs
-rw-r--r--   3 hduser supergroup     926451 2015-05-05 04:58 /fs/hduser/books-output/part-r-00000

hduser@rasdoop1 /usr/local/hadoop $bin/hadoop dfs -cat /fs/hduser/books-output/part-r-00000
...
Congrats! You just ran your first Hadoop job, welcome to the world of
(tiny)big data!
Multiple Nodes
Hadoop has been successfully run on thousands of nodes; this is where we
derive the power of the platform. The first step to getting to many nodes is
getting to 2, so let's do that.
Set up the Secondary Pi
I'll cover cloning a node for the third Pi, so for this one we'll assume
you've set up another Pi the same as the first using the instructions above.
After that, we just need make appropriate changes to the configuration
files.
Important Note: I'll be referring to the nodes as
Node 1 and Node 2 and making the assumption that you have named them that.
Feel free to use different names, just make sure you substitute them in
below. Name resolution will be an issue; we'll touch on that below.
Node 1 will run:
- NameNode
- Secondary NameNode (In a large production cluster this would be
somewhere else)
- DataNode
- JobTracker (In a large production cluster this would be somewhere
else)
- TaskTracker
Node 2 will run:
Normally this is where I planned on writing up an overview of the
different pieces of Hadoop, but upon researching I found an article that
exceeded what I planned to write it by such a magnitude I figured why
bother, I'll just
link
it here. Excellent post by
Brad
Hedlund, be sure to check it out.
On
Node 1, edit masters
nano /usr/local/hadoop/conf/masters
remove "localhost" and add the first node FQDN and save the file:
Node1.domain.ext
Note that conf/masters does NOT determine which node holds "master" roles,
i.e. NameNode, JobTracker, etc. It only defines which node will attempt to
contact the nodes in slaves (below) to initiate start-up.
On
Node 1, edit slaves
nano /usr/local/hadoop/conf/slaves
remove "localhost" add the internal FQDN of all nodes in the cluster and
save the file:
Node1.domain.ext
Node2.domain.ext
On
ALL (both) cluster members edit core-site.xml
nano /usr/local/hadoop/conf/core-site.xml
and change the fs.default.name value to reflect the location of the
NameNode:
<property>
 <name>fs.default.name</name>
 <value>hdfs://node1:54310</value>
</property>
On
ALL (both) cluster members edit mapred-site.xml
nano /usr/local/hadoop/conf/mapred-site.xml
and change the mapred.job.tracker value to reflect the location of the
JobTracker:
<property>
 <name>mapred.job.tracker</name>
 <value>node1:54311</value>
</property>
On
ALL (both) cluster members edit
hdfs-site.xml
nano /usr/local/hadoop/conf/hdfs-site.xml
and change the dfs.replication value to reflect the location of the
JobTracker:
<property>
 <name>dfs.replication</name>
 <value>2</value>
</property>
The
dfs.replication value determines
how
many copies of any given piece of data will exist in the HDFS
site. By default this is set to 3 which is optimal for many small->medium
clusters. In this case we set it to the number of nodes we'll have right
now, 2.
Now we need to ensure the master node can talk to the slave node(s) by
adding the master key to the authorized keys file on each node (just 1 for
now)
On
Node 1, cat your public key and copy it to the
clipboard or some other medium for transfer to the slave node
cat ~/.ssh/id_rsa.pub
On
Node 2
nano ~/.ssh/authorized_keys
and
paste in the key from the master and
save the
file to allow it to take commands.
Name Lookup
The Hadoop nodes should be able to resolve the names of the nodes in the
cluster. To accomplish this we have two options: the right way and the quick
way.
The right way: DNS
The best way to enable name lookup works correctly is by adding the nodes
and their IPs to your internal DNS. Not only does this facilitate standard
Hadoop operation, but it makes it possible to browse around the Hadoop
status web pages (more on that below) from a non-node member, which I
suspect you'll want to do. Those sites are automatically created by Hadoop
all the hyperlinks use the node DNS names, so you need to be able to resolve
those names from a "client" machine. This can scale too; with the right tool
set it's very easy to automate DNS updates when spinning up a node.
To do this option, add your Hadoop hostnames to the DNS zone they reside in.
The quick way: HOSTS
If you don't have access to update your internal DNS zone, you'll need to
use the hosts files on the nodes. This will allow the nodes to talk to each
other via name. There are scenarios where you may want to automate the
updating of node based HOSTS files for performance or fault tolerance
reasons as well, but I won't go into that here.
To use this option do the following:
On
ALL (both) cluster members edit /etc/hosts
nano /etc/hosts
and add each of your nodes with the appropriate IP addresses (mine are only
examples)
192.168.1.40    node1
192.168.1.41    node2
Now that the configuration is done we need to format the HDFS filesystem.
Note:
THIS IS DESTRUCTIVE. Anything currently on your single node
Hadoop system will be deleted.
On
Node 1
bin/hadoop namenode -format
When that is done, let's start the cluster:
cd /usr/local/hadoop
bin/start-all.sh
Just as before, use the jps command to check processes, but this time on
both nodes.
On
Node 1
jps
You should see the following processes: (ignore the number in front, that's
a process ID)
4863 Jps
4003 SecondaryNameNode
4192 TaskTracker
3893 DataNode
3787 NameNode
4079 JobTracker
On
Node 2
jps
You should see the following processes: (ignore the number in front, that's
a process ID)
6365 TaskTracker
7248 Jps
6279 DataNode
If there are problems review the logs. (for detailed location see
reference above) Note that by default each node contains its own logs.
Now let's run the wordcount example in a cluster. To facilitate this you'll
need enough data to split, so when downloading UTF-8 books from
Project
Gutenberg get at least 6 very long books (that should do with default
settings).
Copy them to the local filesystem on your master Hadoop node using SSH (via
SCP or similar). In
my example I've copied the books to
/tmp/books.
Now let's copy the books onto the HDFS filesystem by using the Hadoop
dfs
command. This will automatically replicate data to all nodes.
cd /usr/local/hadoop
bin/hadoop dfs -copyFromLocal /tmp/books /fs/hduser/books
After copying in the book(s) wait a couple minutes for all blocks to
replicate (more on monitoring below) then execute the wordcount example:
bin/hadoop jar hadoop*examples*.jar wordcount /fs/hduser/books /fs/hduser/books-output
Monitoring HDFS/Jobs
Hadoop includes a great set of management web sites that will allow you to
monitor jobs, check logfiles, browse the filesystem, etc. Let's take a
moment to examine the three sites.
JobTracker
By default, the job tracker site can be found at
http://(jobtrackernodename.domain.ext):50030/jobtracker.jsp
; i.e. http://node1.company.com:50030/jobtracker.jsp
On the Job Tracker you can see information regarding the cluster, running
map and reduce tasks, node status, running and completed jobs, and you can
also drill into specific node and task status.
DFSHealth
By default, the DFSHealth site can be found at
http://(NameNodename.domain.ext):50070/dfshealth.jsp
; i.e. http://node1.company.com:50070/dfshealth.jsp
The DFSHealth site allows you to browse the HDFS system, view nodes, look at
space consumption, and check NameNode logs.
TaskTracker
By default, the task tracker site can be found at
http://(nodename.domain.ext):50060/tasktracker.jsp
; i.e. http://node2.company.com:50060/tasktracker.jsp
The Task Tracker site runs on each node that can run a task to provide more
detailed information about what task is running on that node at the time.
Cloning a Node and Adding it to the Cluster
Now we'll explore how to get our third node into the cluster the quickest
way possible: cloning the drive. This will cover, at a high level, the SD
card cloning process for the Pi. If you're using a real machine replace the
drive cloning steps with your favorite (*cough*Clonzilla*cough*) cloning
software, or copy the virtual drive if you are using VMs.
You should always clone a slave node unless you intend on making a new
cluster. To this end, do the following:
- Shut down Node 2 (sudo init 0) and remove
the SD card.
- Insert the SD card into a PC to so we can clone it; I'm using a
Windows 7 machine so if you're using Linux we'll diverge here. (I'll
meet you at the pass!)
- Capture an image to your hdd using your favorite SDcard imaging
software. I use either Roadkill's
Disk Image or dd for
windows.
- Remove the Node 2 SD card and place it back into Node 2. Do not power
up yet.
- Insert a new SD card of the same size to your imaging PC.
- Delete any partitions on the card to ensure error-free imaging. I use
Diskpart , Select Disk x , Clean , exit
where "x" is the disk number. Use list disk to find it...
don't screw up or you'll wipe out your HDD!
- Image the new SD card with the image from Node 2 and remove it from
the PC when complete.
- Insert the newly cloned SD card to Node 3. Power up that node and
leave Node 2 off for now or the IPs will conflict.
Log into the new node (same IP as the cloned node) via ssh with the hduser
(Hadoop user) account and perform the following tasks:
Change the hostname:
sudo nano /etc/hostname
For this example change "Node2" to
"
Node3"
and save the file.
Change the IP address:
sudo nano /etc/network/interfaces
For this example change "192.168.1.41" to "
192.168.1.42"
and save the file. Switch to your own IP address range if necessary.
If you're using HOSTS for name resolution, add Node 3 with the proper IP
address to the hosts file
sudo nano /etc/hosts
Repeat this on the master node and for the sake of
completeness the other node(s) should probably be updated as well. In a
large scale deployment this would all be automated.
If you are using DNS, make sure to add the Node3 entry to your zone.
Reboot Node 3 to enact the IP and hostname changes
sudo reboot
Power up Node 2 again at this time if you had it powered down. Log back into
Node 3 (now with the new IP!) with the hduser account via SSH.
Generate a new key:
ssh-keygen -t rsa -P ""
Copy the key to its own trusted store:
cat ~/.ssh/id_rsa.pub >> ~/.ssh/authorized_keys
If you aren't already, log into Node1 (Master) as hduser via SSH and do the
following:
Add Node 3 to the slaves list
nano /usr/local/hadoop/conf/slaves
SSH to Node 3 to add it to known hosts
ssh rasdoop3
When prompted re: continue connecting type
yes
An
ALL nodes edit hdfs-site.xml
nano /usr/local/hadoop/conf/hdfs-site.xml
Change it to replicate to 3 nodes. Note if you add more nodes to the cluster
after this you would most likely NOT increase this above 3. It's not 1:1
that we're going for, it's the number of replicas we want in the entire
cluster. Once you're running a cluster with > 3 nodes you'll generally
know if you want dfs.replication set to more than 3.
<configuration>
  <property>
    <name>dfs.replication</name>
    <value>3</value>
    <description>Default block replication.
    The actual number of replications can be specified when the file is created.
    The default is used if replication is not specified in create time.
    </description>
  </property>
</configuration>
Now we need to format the filesystem. It is possible, but slightly more
complicated, to clone/add a node without re-formatting the whole HDFS
cluster, but that's a topic for another blog post. Since we have virtually
no data here, we'll address all concerns by wiping clean:
On
Node 1:
cd /usr/local/hadoop
bin/hadoop namenode -format
Now we should be able to start up all three nodes. Let's give it a shot!
On
Node 1:
bin/start-all.sh
Note: If you have issues starting up the Datanodes you may
need to delete the sub-directories under the directory listed in
core-site.xml as "
hadoop.tmp.dir" and then re-format again (see
above).
As for startup troubleshooting and running the wordcount example, copy out
the instructions above after the initial cluster setup. There should be
nothing different from running with two nodes save the fact that you may
need more books to get it working on all 3 nodes.
Postmortem/Additional Reading
You did it! You've now got the experience of setting up a Hadoop cluster
under your belt. There's a ton of directions to go from here; this
relatively new tech is changing the way a lot of companies view data and
business intelligence.
There is so much great community content out there; here's just a small list
of the references I used and some additional reading.
References:
Raspberry
Pi forums: Hadoop + HDFS + MR on Pi cluster - works!
Michael
G. Noll: Running Hadoop on Ubuntu Linux Single-Node Cluster
Michael
G. Noll: Running Hadoop on Ubuntu Linux Multi-Note Cluster
Hadoop
Wiki: Getting Started with Hadoop
Hadoop Wiki: Wordcount
Example
University
of Glasgow's Raspberry Pi Hadoop Project
Hadoop
Wiki: Cluster Setup
Hadoop Wiki:
Java Versions
All
Things Hadoop: Tips, Tricks and Pointers When Setting Up..
Hadoop Wiki: FAQ
Code/Google
Hadoop Toolkit: Hadoop Performance Monitoring
Jeremy
Morgan: How to Overclock the Raspberry Pi


